Performance
 The performance
expectation is greater than 100%. If we give a manager a budget and quota for
production in a given year, we expect next year's figures to improve. In other
words, relative to the initial year, we should be able to reduce funds and/or
expand the yield. The extent to which this could be achieved is dependent on the
learning curve inherent in the exercise. With the benefit of industry experience
in many commodity domains for production, learning curve indices are readily available
for reference. The performance
expectation is greater than 100%. If we give a manager a budget and quota for
production in a given year, we expect next year's figures to improve. In other
words, relative to the initial year, we should be able to reduce funds and/or
expand the yield. The extent to which this could be achieved is dependent on the
learning curve inherent in the exercise. With the benefit of industry experience
in many commodity domains for production, learning curve indices are readily available
for reference.
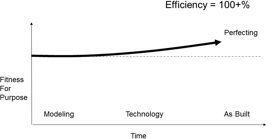
To position this performance expectation within the context of the other Levels,
the figure shows time on the X-axis and "Fitness For Purpose" on the Y-axis.
Depending on the learning curve for a particular commodity, the trajectory
of performance relative to the initial baseline should steadily and exponentially
increase through time, albeit with diminished expectations as the process trends
toward a peak optimization.
A key consideration in achieving optimization is the overhead investment —
automating machinery, software and the like that enable greater efficiency.
|