Illustration of Learning Curve Application
For purposes of illustration, consider the following hypothetical case. The
construction of floors on a 25 storey concrete high-rise building are being tracked.
From the second floor up, all floors are virtually the same, so that the second
floor is the first of a uniform series of 24. The roof and mechanical penthouse
are not included in the observations. Construction data is collected as follows.[5]
Time sheets are carefully marked up with job allocations, and hours are abstracted
for forming and pouring concrete on each standard floor. The man-hours for the
first in the series is noted as 1175 man-hours. The second, third and fourth
in the series take 855, 905, and 735 respectively. This data is plotted on log-log
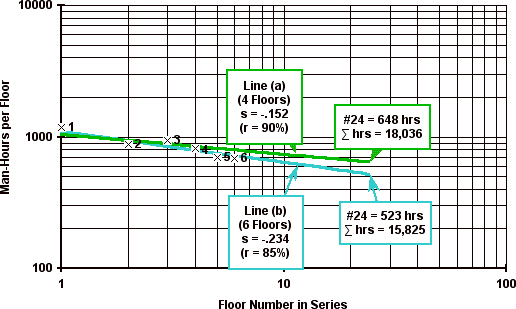
paper using the LL-U Model as shown by line (a) in Figure 11.
At this stage the data suggests a line whose slope is -.152 (approx. 90% learning
ratio) and that future floors would be expected to take the times shown in Column
1b of Table 3.
|
|
Col 1a
|
Col 1b
|
Col 2a
|
Col 2b
|
Col 3
|
|
Floor#
|
Observed
4 floors
|
Projected
90% learning
|
Observed
6 floors
|
Projected
85% learning
|
Final
All floors
|
| |
|
1
|
1175
|
|
1175
|
|
1175
|
|
2
|
880
|
|
880
|
|
880
|
|
3
|
940
|
|
940
|
|
940
|
|
4
|
820
|
|
820
|
|
820
|
|
5
|
|
822
|
700
|
|
700
|
|
6
|
|
800
|
690
|
|
690
|
|
7
|
|
781
|
|
698
|
620
|
|
8
|
|
765
|
|
676
|
700
|
|
9
|
|
752
|
|
658
|
695
|
|
10
|
|
740
|
|
642
|
720
|
|
11
|
|
729
|
|
628
|
650
|
|
12
|
|
720
|
|
615
|
620
|
|
13
|
|
711
|
|
604
|
680
|
|
14
|
|
703
|
|
593
|
670
|
|
15
|
|
696
|
|
584
|
710
|
|
16
|
|
689
|
|
575
|
660
|
|
17
|
|
683
|
|
567
|
640
|
|
18
|
|
677
|
|
559
|
670
|
|
19
|
|
671
|
|
552
|
750
|
|
20
|
|
666
|
|
546
|
710
|
|
21
|
|
661
|
|
540
|
850
|
|
22
|
|
656
|
|
534
|
790
|
|
23
|
|
652
|
|
528
|
935
|
|
24
|
|
648
|
|
523
|
1060
|
|
Projected Totals:-
|
18036
|
|
15825
|
|
|
Final Total:-
|
|
|
|
18,335
|
Table 3: High-rise repetitive construction: hypothetical case
However, suppose actual records for the next two floors, five and six, produce
results of 700 and 690 respectively. The addition of the latest data suggests
a new line whose slope is -.234 (approx. 85%) as shown by line (b) in Figure
11, and the new times taken to complete are as shown in Table
3, Column 2b. The new result shows a reduction in total hours of approximately
2200 hours (12%, or the equivalent of some four extra floors).
Figure 11: High-rise repetitive construction:
four floors projected (green), and six floors projected (turquoise)
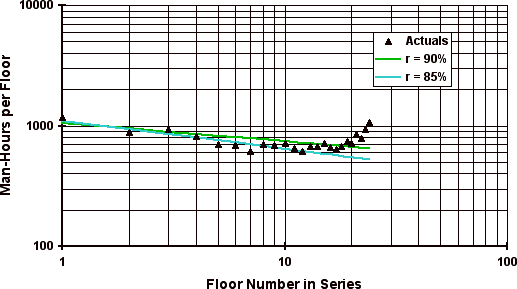
Typically, practical reality follows neither of the two models. When record
keeping is continued until all floors are completed, the results could be as
shown in Table 3, Column 3. These results are shown plotted
in Figure 12. Many projects experience a decrease in productivity
at the end of a run of work, (Barrie, Paulson 1978) and in the example
the "tail end" departs significantly from either of the two earlier
projections. The total man-hours shown in Table 3, Column
3 is 15% higher than the second projected total in column 2b.
Figure 12: High-rise repetitive construction:
cumulative unit projections and observed (LL-U model)
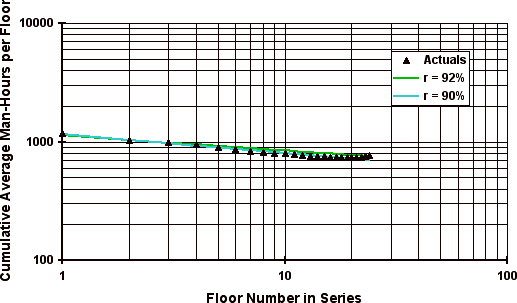
The same data, plotted according to the LL-CA Model, are shown in Figure
13. It will be seen that this model substantially conceals the significant
changes in trends associated with the "tail end" effect. Thus, the
LL-U Model, although not consistent with the original theory, is a more useful
tool in many practical applications and for project management observation and
control.
Figure 13: High-rise repetitive construction:
cumulative average projections and observed (LL-CA model)
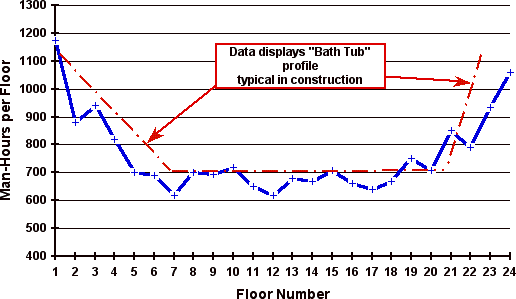
When the figures shown in Table 3, Column 3 are plotted
at normal scales, they display a shape sometimes referred to as the "Bath
Tub" effect as shown in Figure 14. In fact, this is
simply a reflection of some of the considerations associated with each of the
three stages of the S-curve discussed in an earlier section.
Figure 14: High-rise repetitive construction: showing the "bath tub"
effect
This suggests that the application of "Learning Curve Theory" on
a construction site should be limited to the first 25% or so of the total production
under consideration, which is to say approximately 30-35% of the allotted time.
In the high-rise construction example, the target for reaching optimum performance
must be the 6th or 7th floor.
5. The
variation of "actuals" selected for the illustration are within the authors experience.
|