Generating S-curves
Project Benchmarks
Percentage S-curves may be used to calculate important project benchmarks on an ongoing basis, including:
- Project percentage growth (Target and Baseline S-curves)
- Project percentage slippage (Target and Baseline S-curves)
- Actual percentage complete against Target percentage complete to date
- Actual percentage complete against Baseline percentage complete to date
How is an S-curve Generated?
To generate a Baseline S-curve, a Baseline Schedule is required.
The Baseline Schedules should contain the following information for each task:
- Baseline Start Date, Finish Date
- Baseline Man Hours and/or Costs
To generate Actual and Target S-curves, a Production Schedule is required.
The Production Schedules should contain the following information for each task:
- Actual Start Date, Finish Date
- Actual Man Hours and/or Costs
- Actual Percentage Complete
Worked Example
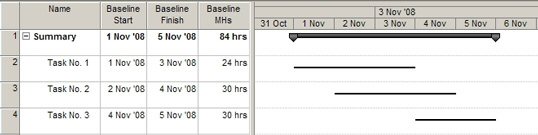
To better understand how S-curves are generated, consider a simple project comprising three tasks.
A Baseline Schedule prepared using MS Project for this project is shown below.
Figure 9: Sample Baseline Schedule
Baseline Man Hours versus Time S-curve
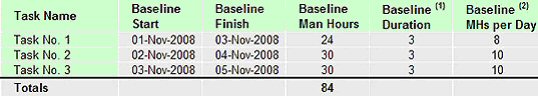
To generate a Baseline Man Hours versus Time S-curve, two sets of calculations are performed.
The first set of calculations is performed for each task in the Baseline Schedule.
- Calculate the duration in days for each task
i.e. Baseline Duration = Baseline Finish Date - Baseline Start Date + 1
- Calculate Man Hours per day for each task
i.e. Baseline MHs per Day = Baseline Man Hours / Baseline Duration
These calculations are shown in the following table.
Figure 10: Baseline S-curve Calculation 1 of 2
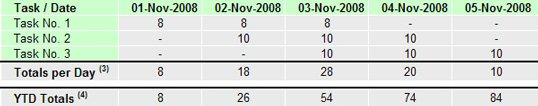
The second set of calculations is performed for each day in the Baseline Schedule.
- Calculate the total Man Hours per Day for all tasks.
- Calculate the Year To Date Total for Man Hours per Day for all tasks.
These calculations are shown in the following table.
Figure 11: Baseline S-curve Calculation 2 of 2
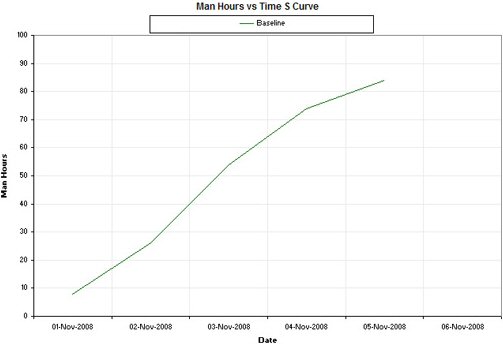
The S-curve is constructed by assigning the Dates to the X Axis, and the YTD values to the Y Axis.
The resulting Baseline Man Hours versus Time S-curve is shown below.
Figure 12: Baseline Man Hours versus Time S-curve
|