Appendix B: The Performance Dashboard
Purpose
The purpose of the performance dashboard is to focus the audience's attention
on the critical information they need to help in their decision-making. The intent
is to enable advocacy and proactive intervention as and when required.
Target Audience
There are two target audiences for the dashboard, the decision-makers and the
project team. The decision-makers rely on the information to reaffirm the terms
of reference established in the approved project charter. For the project team,
it is the basis upon which their capability and diligence is assessed. Integrity
in this reporting requires a tailoring to the complexity level confronted by the
team. The dashboard must be appropriate to complexity level. Integrity in reporting
requires that performance be measured at each level.
Other Considerations
Think of the dashboard as an artist's rendering. Starting with a blank canvas,
your role is to tell the story. The story is yours to tell — don't reverse
engineer the story based on convention — tell it like you see it! Integrity
in reporting requires that the story be an accurate one.
Key information conveyed can be categorized as:
"Primary Information",
"Collateral Information",
"Contextual Information", and
"Tombstone Information".
Primary Information refers to the central theme, the single most important
message on the page. It should be a prominent graphic, roughly 50% of the visual
field. Collateral Information refers to other information necessary for
providing a sufficient account of performance. This should be limited to 30% of
the visual field. Contextual Information refers to representations of what
has changed in the reporting interval. 15% Tombstone Information provides
a reminder of the essential elements of the endeavor, information that remains
unchanged from reporting period to reporting period. This should be limited to
5% of the visual field.
 Generally
green/yellow/red signifies good/caution/problem respectively. Obviously population
of display objects should be based on accuracy of data or where conjecture is
used, the object should be annotated accordingly with a footnote. Generally
green/yellow/red signifies good/caution/problem respectively. Obviously population
of display objects should be based on accuracy of data or where conjecture is
used, the object should be annotated accordingly with a footnote.
Trends in data provide important information regarding whether the performance
is improving or degrading, providing a basis for extrapolation.
In the defence world, a chaff launcher can be deployed as a decoy to take the
interrogator off target. Similarly, many other spectacular plots and illustrations
can be added to your report as a campaign of message avoidance.
The Dashboard Issue
The dashboard is often crafted based on what the stakeholders want to see.
For complex projects, pandering to stakeholder desires can often result in a simpler
than possible formulation, a rendering that is neither accurate to the challenge
at hand nor accurate to the problem practitioners are confronting.
Applying level 2 dashboards in Level 3, 4 or 5 worlds, leaves the practitioners
to work incognito, against the system, to deal with the primary dilemma.
Level 1 Dashboard
The Level 1 story is about control — Stability of rules and alignment
of the work with those rules.
Primary Information — the primary graphic addresses the question:
will I hit my quota? Process control charts displaying yield versus targets and
quality variation support this message.
Collateral Information — is for sufficiency in messaging, i.e.,
information supporting the primary graphic.
Contextual Information — represents other general topical information
that is included if essential to complete the picture — see Performance Dashboard
graphic.

Tomb Stone Information — generally includes:
- The name of the initiative
- The DBM classification: Level 1
- The reporting regime: Control Chart
- A brief description that establishes the context at Level 1
- The client or sponsor and a brief description of their expectations,
- E.g. perhaps the dollar value.
Level 2 Dashboard
The Level 2 story is about progress — Stability of methods and alignment
of the work with those methods.
Primary Information — the primary graphic addresses the question:
will I achieve schedule? A Gantt chart[1]
displaying the project planned schedule and the actual achievement supports this
message.
Collateral Information — information supporting the primary graphic
includes, for example:
- Contextual Information — other general topical information may include:
- Schedule variations and opportunities to Fast Track or Crash the schedule.
Tombstone Information — generally includes:
- The name of the initiative
- The DBM classification: Level 2
- The reporting regime: Schedule
- A brief description that establishes the context at Level 2
- The client or sponsor and a brief description of their expectations, and
- Perhaps the dollar value
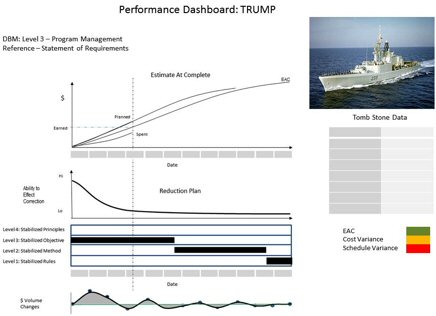
Level 3 Dashboard
The Level 3 story is about proof of concept — Stability of Objectives
and alignment of the work with those Objectives.
Primary Information — the primary graphic addresses the question:
is this going to work? An Earned Value plot with Estimate at Complete will support
this message.
Collateral Information — for sufficiency in messaging, information
supporting the primary graphic includes, for example: The planned reduction of
the baseline to Level 2
Contextual Information — other general topical information may
include:
Tombstone Information — that generally includes:
- The name of the initiative
- The DBM classification: Level 3
- The reporting regime: Earned Value / EAC
- A brief description that establishes the context at Level 3
- The client or sponsor and a brief description of their expectations, and
- Perhaps the dollar value
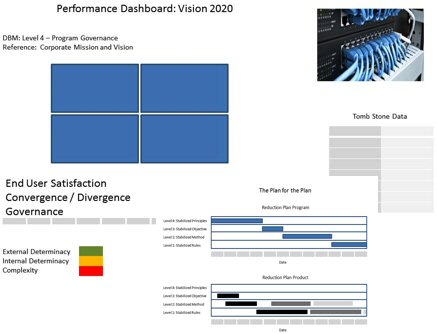
Level 4 Dashboard
The Level 4 story is about sustainability — Stability of Principles and
alignment of the work with those principles.
Primary Information — the primary graphic should address the question:
will I further the corporate vision? A Balanced Score card and trends in achievement
thereof will support this message.
Collateral Information — the alignment between the internal-to-project
functionality and the corporate determinacies. The performance dashboard provides
stakeholders with the prognosis for interception of the initiative with the corporate
mission and vision. As such, the story provides stakeholders vital information
on the health, currency and viability of the corporate mission and vision. The
Balanced Scorecard approach positions project performance within the context of
competing interests.
Contextual information — should address adequacy of the principles,
application of the principles, alignment of the process with the principles, and
stability of the principles.
Collateral Information — That is for sufficiency in messaging,
information supporting the primary graphic.
Contextual Information — other general topical information.
Tomb Stone Information — generally includes:
- The name of the initiative
- The DBM classification: Level 4
- The reporting regime: Balanced Scorecard
- A brief description that establishes the context at Level 4
- The client or sponsor and a brief description of their expectations, and
- Perhaps the dollar value
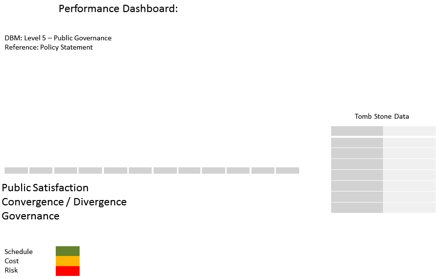
Level 5 Dashboard
The Level 5 story is about prosperity — Stability of values and alignment
of the work with those values.
Primary Information — The primary graphic should address the question:
will the public support it? The primary information is the alignment between the
internal-to-project functionality and the public determinacies. The performance
dashboard provides stakeholders with the prognosis for interception of the initiative
with the public will. As such, the story provides stakeholders vital information
on the health, currency and viability of the public policy and/or the utility
of the organization in industry. The Balanced Scorecard approach positions project
performance within the context of competing interests.
Contextual information — should address adequacy of the Values,
application of the Values, alignment of the process with the Values, and stability
of the Values.
Collateral Information — For sufficiency in messaging, further
information supports the primary graphic.
Contextual Information — other general topical information.
Tombstone Information — generally includes:
- The name of the initiative.
- The DBM classification: Level 5
- The reporting regime: Balanced Scorecard
- A brief description that establishes the context at Level 5
- The client or sponsor and a brief description of their expectations, and
- Perhaps the dollar value
1. Wilson,
James M., Gantt charts: A centenary appreciation European Journal of Operational
Research, 2003.
|